



Just like a doctor uses a thermometer and blood tests to check your health, the government uses economic indicators to measure the health of the country’s economy. Because the world changes fast, the tools used to measure the economy need regular updates to stay accurate.
Recently, the Indian government announced massive updates to its economic measuring tools, changing their “base years” (the starting point used for comparison) and adding brand-new trackers.
Here is a simple, easy-to-understand breakdown of what is changing.
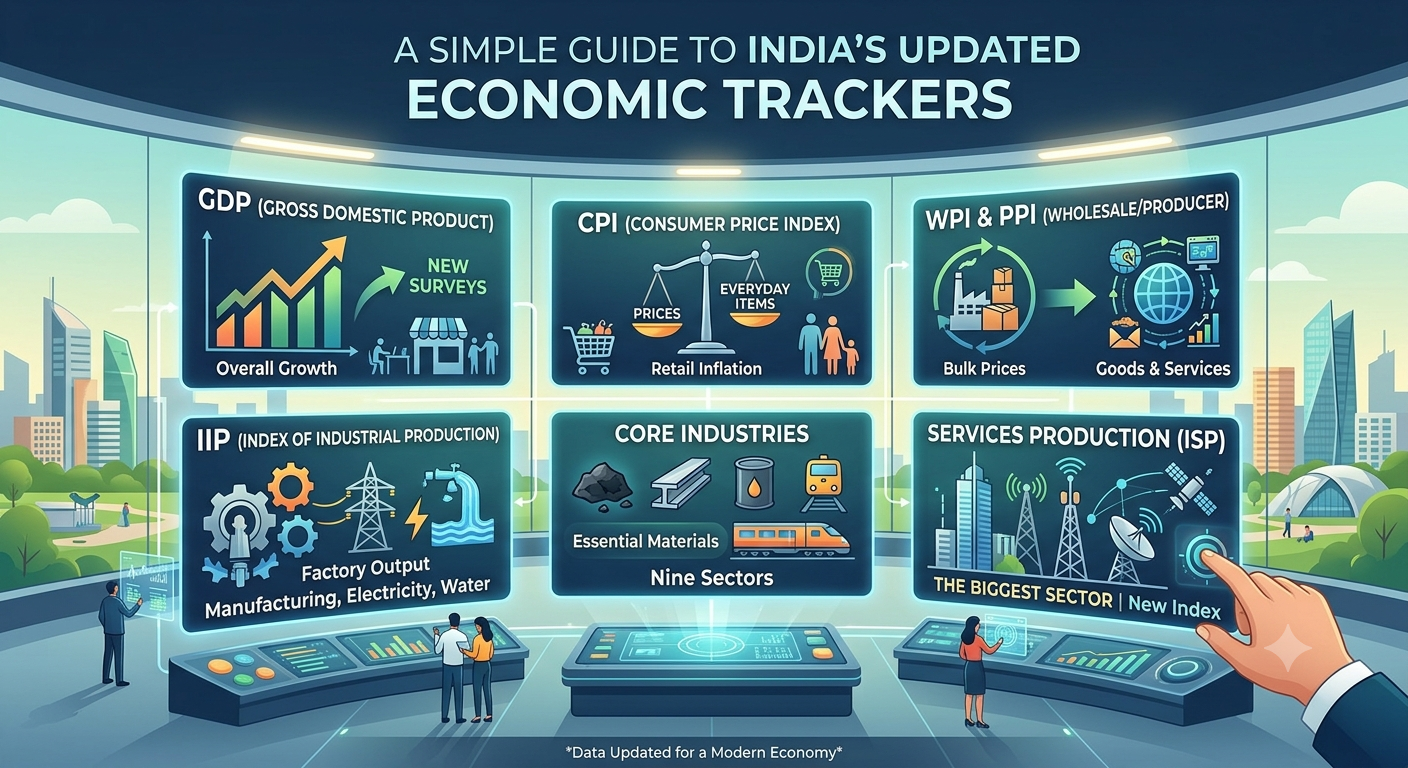
1. Tracking Overall Growth: GDP
Gross Domestic Product (GDP) is the total value of everything produced in the country.
The Update: The comparison starting point (base year) has moved from 2011-2012 to 2022-2023.
Why it matters: In the past, it was hard to accurately count the money made by small, informal businesses. The government has launched a new yearly survey to capture this data, making the new GDP numbers much more reliable.
2. Tracking Everyday Prices: CPI
The Consumer Price Index (CPI) measures retail inflation. It tracks the prices you and I pay for daily goods and services. The Reserve Bank of India uses this to decide on interest rates.
The Update: The base year is now 2024.
Why it matters: Because our shopping habits change, the government updated the CPI “basket” (the list of items it tracks) from 299 to 358 everyday goods and services.
3. Tracking Bulk Prices: WPI and the new PPI
The Wholesale Price Index (WPI) measures the prices of goods traded in massive bulk by businesses. However, it is getting an upgrade.
The WPI Update: The base year shifted to 2022-2023, and the number of bulk items tracked jumped from 697 to 957.
The Big Change (PPI): WPI is actually going to be retired. The government is introducing the Producer Price Index (PPI), a more modern tool used by developed countries.
Why PPI is better: While WPI only tracks physical goods, PPI tracks both goods and services (like banking, railways, and telecom). Both WPI and PPI will run side-by-side for five years, and then WPI will be permanently shut down.
4. Tracking Factory Output: IIP
The Index of Industrial Production (IIP) acts as a report card for India’s factories and manufacturing plants.
The Update: The base year is now 2022-2023.
Why it matters: Previously, the IIP only tracked mining, manufacturing, and electricity/gas. Now, it will also measure a fourth category: water supply, sewage, and waste management.
5. Tracking Crucial Materials: Core Industries
The Index of Core Industries tracks the essential raw materials needed to keep the country running (like coal, steel, cement, and electricity).
The Update: This list just grew. Because iron ore is now heavily traded and consumed in India, it was added to the list.
Why it matters: The index now tracks nine core industries instead of eight, with a new base year of 2022-2023.
6. Tracking the Biggest Sector: The New ISP
For a long time, India only had a dedicated tracker for factories and industries. However, services (like IT, banking, and hospitality) make up more than half of India’s entire economy and provide massive employment.
The Update: The government created a brand-new tool called the Index of Services Production (ISP).
Why it matters: Using a base year of 2024-2025, this new tool will specifically track output changes across 19 different service areas. This gives the government a much clearer picture of how the largest part of the economy is actually performing.
The Bottom Line: By retiring old trackers, adding modern ones, and updating what is actually being counted, the government is ensuring its economic data reflects the real, modern-day India. Better data means smarter policies for the future.